Risk Management for Decision-Makers: A Practical Guide
Unlock effective decision-making with our practical guide to risk management, enhancing strategic performance and safeguarding your organization.


Risk management is the systematic process of identifying, assessing, and responding to threats and opportunities that affect an organization’s ability to achieve its objectives. Per ISO 31000 and the COSO ERM Framework, it is not a standalone compliance function but a discipline integrated with strategy and performance. The core cycle runs four stages: identify what could go wrong (or right), assess likelihood and impact, respond with controls or treatment plans, and monitor for changes. Done well, it shifts decisions from gut-feel to evidence, protects value in downturns, and creates room for deliberate risk-taking when the upside justifies it. The NC State ERM Initiative has tracked this gap for years: organizations that embed risk into strategy outperform those that treat it as a reporting exercise.
Statistic: NC State’s 15th Edition State of Risk Oversight survey found that fewer than half of organizations report having a complete, formal enterprise-wide risk management process in place.
Key Takeaways
Effective risk management is a decision-enabling capability, not a compliance checklist: organizations that embed it in strategy, assign clear ownership, and monitor with leading KRIs consistently outperform those that treat it as a reporting exercise.
| Point | Details |
|---|---|
| Embed risk in strategy | Risk management integrated with strategic planning produces better decisions and measurable performance advantages. |
| Follow the five-step process | Identify, assess, treat, report, and monitor form a repeatable cycle applicable at any organizational scale. |
| Use frameworks as tools, not rules | COSO ERM suits board-level governance; ISO 31000 scales internationally; NIST CSF targets cyber and IT risk specifically. |
| Fewer than half have mature ERM | NC State’s survey found most organizations lack a complete, formal enterprise-wide risk process, creating a competitive gap. |
| DocuPOW speeds risk data capture | AI-driven document extraction populates risk registers and KRI feeds faster and with fewer errors than manual entry. |
Table of Contents
- What is risk management and why does it matter?
- How the risk management process works step by step
- What types of risk do organizations typically face?
- Which frameworks should you use: COSO, ISO 31000, or NIST?
- How do you assess risk: qualitative, quantitative, or both?
- What are the five risk response strategies?
- Who owns risk, and how does governance actually work?
- How do you design KRIs, dashboards, and reporting cadence?
- What does a mature risk program look like, and what gets in the way?
- Practical examples of risk management applied
- How to get started: a 90-day checklist
- Why risk management must be strategic, not administrative
- DocuPOW cuts the manual work that slows risk programs down
- Sources
- FAQ
What is risk management and why does it matter?
Risk management covers every deliberate effort an organization makes to understand uncertainty and decide how to handle it. The U.S. EPA frames it as the process of deciding whether and how to manage risks, requiring consideration of legal, economic, and behavioral factors. That framing matters: risk is not just a financial or technical problem. It is a decision problem.
Scope is broader than most people assume. Enterprise risk management (ERM) spans strategic, financial, operational, compliance, cyber, ESG, and reputational risk. Project risk management focuses on schedule, cost, and scope. Functional risk programs (IT, treasury, legal) go deeper in a single domain. All of them share the same underlying logic.
One distinction worth making early: risk is not only downside. ISO 31000 explicitly defines risk as the effect of uncertainty on objectives, which includes upside deviation. A supply disruption is a risk. So is a competitor’s sudden exit from a market. The organizations that only manage threats miss the opportunity side entirely.
Typical artifacts that a mature program produces include:
- Risk register: a living inventory of identified risks with owners, scores, and treatment status
- Risk appetite statement: a board-approved declaration of how much uncertainty the organization will accept in pursuit of its goals
- Risk matrix (heat map): a visual grid plotting likelihood against impact to prioritize attention
- Control library: documented controls mapped to specific risks, with testing schedules and owners
How the risk management process works step by step
A practical five-step process covers the full lifecycle: identify, assess, mitigate/treat, report, and monitor. Most frameworks add a context-setting step at the front, which is worth keeping because scope decisions made early prevent scope creep later.
The stages in order:
- Set scope and context. Define the objectives being protected, the organizational units in scope, and the time horizon. Agree on the risk taxonomy and scoring criteria before the first workshop.
- Identify risks. Use workshops, interviews, process walkthroughs, and external horizon scanning. Document each risk as a cause-event-consequence statement, not just a label.
- Analyze and assess. Score each risk on likelihood and impact using agreed scales. Apply qualitative scoring first; add quantitative modeling for high-priority items.
- Evaluate and prioritize. Compare residual risk ratings against appetite thresholds to decide which risks need treatment, which can be accepted, and which require escalation.
- Treat and respond. Select and implement controls, transfer mechanisms (insurance, contracts), or avoidance decisions. Assign an owner and a target residual rating.
- Monitor and report. Track KRIs, test controls, and report to the right audience on the right cadence. Trigger escalation when thresholds breach.
Mini risk register schema (copy and adapt):
| Field | Description |
|---|---|
| Risk ID | Unique identifier |
| Risk description | Cause → event → consequence statement |
| Owner | Named individual accountable for the risk |
| Likelihood (1–5) | Probability score using agreed scale |
| Impact (1–5) | Consequence score using agreed scale |
| Risk score | Likelihood × Impact |
| Existing controls | Current mitigations in place |
| Response strategy | Avoid / Reduce / Transfer / Accept / Exploit |
| Residual score | Score after controls applied |
| Status | Open / In treatment / Closed |
| KRI assigned | Yes / No, with metric name |
For a single risk moving through the lifecycle, the checklist is short: assign an owner on day one, document the control and test it within 30 days, assign at least one leading KRI, set an escalation threshold, and review status at the next governance meeting.
What types of risk do organizations typically face?
Risk categories vary by industry, but the following taxonomy covers most U.S. enterprise contexts. Knowing who typically owns each type prevents accountability gaps.
| Risk Type | Example | Typical Owner |
|---|---|---|
| Strategic | Market shift erodes core product revenue | CEO / Board |
| Financial | FX exposure on overseas receivables | CFO / Treasurer |
| Operational | Manufacturing line failure causes delivery delay | COO |
| Compliance / Regulatory | GDPR or CCPA violation triggers fine | General Counsel / CCO |
| Cyber / IT | Ransomware encrypts production systems | CISO / CIO |
| Reputational | Product recall covered by national media | CEO / CMO |
| Market | Interest rate rise increases debt service cost | CFO |
| Supply chain | Single-source supplier exits the market | COO / CPO |
| ESG / Climate | Physical flood risk to a key facility | CSO / COO |
| Model / Third-party | Vendor algorithm produces biased outputs | CRO / CIO |
| Human capital | Key-person dependency in a critical function | CHRO |

Three cross-cutting risks deserve special attention right now. AI risk spans governance, bias, explainability, and third-party model dependency. Climate risk is increasingly material for physical assets and regulatory disclosure (SEC climate rules are still evolving). Geopolitical risk, from export controls to sanctions, is reshaping supply chains faster than most annual risk cycles can track.
Which frameworks should you use: COSO, ISO 31000, or NIST?
No single framework is universally correct. The right choice depends on your organization’s size, regulatory environment, and primary risk concern.
COSO’s ERM Framework organizes enterprise risk management into five interrelated components: governance and culture; strategy and objective-setting; performance; review and revision; and information, communication, and reporting. It is the dominant standard for U.S. public companies and audit committees because it explicitly links risk to strategy and performance, not just controls.
ISO 31000 is a principles-based international standard that works at any organizational scale. It does not prescribe a specific process structure, which makes it easier to adapt across industries and geographies. Organizations operating internationally or wanting a framework that integrates with quality management (ISO 9001) often prefer it.
NIST’s Cybersecurity Framework (CSF) is purpose-built for cyber and technology risk. Its five functions (Identify, Protect, Detect, Respond, Recover) map directly to IT security operations and are referenced by U.S. federal agencies and critical infrastructure operators. NIST SP 800-30 extends that into a full IT risk assessment methodology.
| Framework | Best When | Primary Audience | Key Artifacts |
|---|---|---|---|
| COSO ERM | Strategy-level governance, U.S. public companies, board reporting | Board, CRO, CFO, internal audit | Risk appetite statement, ERM policy, control framework |
| ISO 31000 | International operations, scalable cross-functional programs | CRO, operations, quality teams | Risk register, risk criteria, treatment plan |
| NIST CSF | Cyber and IT risk, federal contractors, critical infrastructure | CISO, IT security, compliance | Cybersecurity profile, control catalog, incident playbook |
Most mature programs combine frameworks rather than pick one. A U.S. manufacturer might use COSO for board-level ERM governance, ISO 31000 for operational risk processes across global sites, and NIST CSF for its IT security program. Adopting means taking the framework’s structure as-is; adapting means using its principles while adjusting terminology and process to fit your culture. Adapting almost always wins in practice.
Pro Tip: Before selecting a framework, map your regulatory obligations first. A federal contractor subject to FISMA has NIST as a near-requirement. A public company with an active audit committee will find COSO language already embedded in its governance documents.
How do you assess risk: qualitative, quantitative, or both?
Assessment method choice is a practical decision, not a philosophical one. Qualitative scoring (workshops, expert judgment, 5×5 likelihood-impact matrices) is fast, low-cost, and sufficient for most risks in a first-pass register. It works well when data is sparse or when you need broad coverage quickly.
Quantitative methods (monetary exposure calculations, Monte Carlo simulation, scenario modeling, value-at-risk) are worth the extra effort when:
- The decision involves a capital allocation above a material threshold
- A regulator requires it (Basel III for banks, Solvency II for insurers)
- The risk has a measurable historical loss distribution
- Scenario analysis is needed to stress-test a strategic plan
Visual artifacts that make assessments actionable:
- Heat map / risk matrix: plots risks by likelihood and impact; color-coded zones (red/amber/green) guide prioritization at a glance
- Bow-tie diagram: maps causes on the left, the risk event in the center, and consequences on the right, with controls shown on each side
- KRI dashboard: tracks leading indicators with threshold lines; a breach triggers a defined response
- Monte Carlo output: shows a probability distribution of outcomes for a specific exposure (project cost, revenue, credit loss)
- Scenario table: documents named scenarios (base, adverse, severe) with assumptions and financial impacts
Modern tooling has changed what is practical. GRC platforms (Governance, Risk, and Compliance suites) centralize registers, automate control testing, and generate board-ready reports. BI tools like Power BI and Tableau turn static spreadsheet data into live dashboards that embed risk into operational workflows. AI-enabled data extraction removes the manual burden of updating registers from source documents, contracts, and incident reports, freeing analysts for scenario work.
Pro Tip: Invest in quantitative modeling only when the decision it informs is large enough to justify it. A $500K operational risk does not need a Monte Carlo model. A $50M capital investment or a regulatory capital calculation does.
What are the five risk response strategies?
Every risk treatment decision maps to one of five canonical responses. In practice, most treatment plans combine two or more.
Avoid: Eliminate the activity that creates the risk. A U.S. manufacturer exits a high-conflict market rather than manage the geopolitical exposure.
Reduce (mitigate): Implement controls that lower likelihood, impact, or both. A retailer adds multi-factor authentication to cut the probability of a credential-stuffing attack.
Transfer: Shift the financial consequence to a third party. A construction firm buys builder’s risk insurance and includes indemnification clauses in subcontractor agreements.
Accept: Consciously retain the risk because the cost of treatment exceeds the expected loss. A small firm accepts the risk of a single-server failure because the downtime cost is lower than a redundant infrastructure investment.
Exploit (opportunity): For upside risks, take deliberate action to increase the probability of a positive outcome. A tech company accelerates a product launch when a competitor stumbles.
Combination strategies are common. Reduce plus transfer is the standard approach for cyber risk: harden the environment (reduce), then buy cyber liability insurance (transfer). Acceptance is appropriate only when it is documented and approved at the right governance level. Undocumented acceptance is not a strategy; it is an oversight gap.
Who owns risk, and how does governance actually work?
Governance is where risk management either gets real authority or becomes a reporting exercise. The typical structure in a U.S. enterprise looks like this:
- Board / Audit Committee: Sets risk appetite, oversees the ERM program, receives quarterly or semi-annual risk reports, and challenges management on emerging risks
- Chief Risk Officer (CRO): Owns the ERM framework, chairs the risk committee, reports to the CEO and board, and is accountable for the program’s maturity
- Risk Committee: Cross-functional senior leadership body that reviews the top risk register, approves treatment plans, and escalates to the board
- Risk Owners: Business unit leaders accountable for specific risks in their domain; they update status, test controls, and report KRI breaches
- Control Owners: Individuals responsible for operating specific controls; distinct from risk owners in mature programs
- Internal Audit: Provides independent assurance that controls are operating effectively; not a risk owner but a critical check on the program’s integrity
Risk appetite is the mechanism that connects governance to strategy. A board-approved appetite statement defines how much uncertainty the organization will accept in pursuit of its objectives, expressed in qualitative terms (“we will not accept risks that threaten regulatory licensure”) and quantitative thresholds (maximum tolerable earnings volatility, liquidity floor). When a proposed strategy pushes risk exposure above appetite, the board either adjusts the strategy or explicitly accepts the deviation.
A practical example: a CFO proposes a leveraged acquisition. The risk team models the combined entity’s debt-service coverage under three scenarios (base, adverse, severe). The analysis shows the severe scenario breaches the board’s stated liquidity appetite. The board either renegotiates the deal structure, adds a covenant, or formally accepts the breach with a documented rationale. That is risk management integrated into a capital decision, not bolted on afterward.
Compliance documentation practices that support audit-ready governance are increasingly important as regulators expect boards to demonstrate active oversight, not just passive receipt of reports.
How do you design KRIs, dashboards, and reporting cadence?
A KRI (Key Risk Indicator) is a metric that signals a change in risk exposure before a loss event occurs. The distinction between leading and lagging matters: a lagging indicator (number of incidents last quarter) tells you what happened; a leading indicator (percentage of overdue control tests, staff turnover in a critical function) tells you what is likely to happen.
Good KRI design follows four rules: the metric must be measurable with available data, it must have a defined threshold that triggers a response, it must have a named owner, and it must be reviewed on a cadence that matches the risk’s speed of change.
| Metric | Risk Type | Audience | Cadence |
|---|---|---|---|
| Number of critical control failures | Operational | Ops Lead / CRO | Weekly |
| Cyber incident count (severity 1–2) | Cyber / IT | CISO / CRO | Daily / Weekly |
| Regulatory breach notifications received | Compliance | GC / CCO / Board | As-occurs / Monthly |
| Financial exposure ($M) by risk category | Financial / Strategic | CFO / CRO / Board | Monthly / Quarterly |
| KRI threshold breaches (count) | All | CRO / Risk Committee | Monthly |
| Control effectiveness score (%) | All | Internal Audit / CRO | Quarterly |
| Top-10 risk score movement (quarter-on-quarter) | Strategic | Board / CEO | Quarterly |
Reporting cadence should match the audience’s decision cycle. Operational teams need weekly or daily signals. The CRO and risk committee need monthly summaries with trend lines. The board needs a quarterly narrative that connects risk exposure to strategic objectives, not a 40-slide deck of heat maps.
Escalation triggers should be pre-defined: a KRI breach above the red threshold, a new risk scoring above a materiality floor, or a control failure in a critical process all warrant immediate escalation outside the normal cadence.
What does a mature risk program look like, and what gets in the way?
NC State’s ERM Initiative survey data shows that many organizations still identify risks only annually and give limited attention to emerging strategic risks. That is a maturity problem with a predictable cause: risk management was built as a compliance function, not a decision-support function.
Statistic: Fewer than half of surveyed organizations report a complete, formal ERM process. Strategic and emerging risks receive the least systematic attention of any risk category.
A mature program has five characteristics: risks are identified continuously (not just annually), risk information reaches decision forums in time to influence choices, appetite is defined and used to evaluate strategy, controls are tested rather than assumed, and the program is owned by the business, not just the risk team.
Common barriers:
- Siloed ownership: Risk lives in the risk department; business units see it as overhead
- Data quality: Risk registers built in spreadsheets go stale within weeks of completion
- Talent gap: Few organizations have analysts who can build a Monte Carlo model and explain it to a board in plain language
- Tool fragmentation: Risk data sits in five different systems with no integration
- Culture: Leaders who surface bad news get penalized; risks stay hidden
Timeline scenarios:
- 0–3 months (quick start): Appoint a risk owner, run a rapid identification workshop, build a top-10 risk register, assign KRIs to the top three risks
- 3–12 months (build): Formalize the risk appetite statement, establish a risk committee, implement a basic GRC tool or structured spreadsheet, begin quarterly reporting
- 12–36 months (enterprise integration): Integrate risk into strategic planning and capital allocation, automate KRI data feeds, achieve board-level risk reporting maturity
Key cost drivers are people (a CRO or senior risk analyst), tooling (GRC platforms range from low-cost SaaS to six-figure enterprise deployments), data integration (connecting risk data to ERP and operational systems), external advisory (framework design and training), and ongoing training.
Pro Tip: Pick one high-volume, document-heavy process (claims processing, contract review, vendor onboarding) and automate the data extraction from it. The time saved funds the next phase of the program and demonstrates ROI to skeptical executives.
Practical examples of risk management applied
Four use cases show how the process translates across different organizational contexts.
Finance / Treasury liquidity risk: A mid-size manufacturer holds 60 days of operating cash. The risk team models a scenario where a major customer delays payment by 45 days simultaneously with a raw material price spike. The KRI is days-cash-on-hand, with a red threshold at 30 days. The treatment plan combines a pre-approved revolving credit facility (transfer/reduce) and a supplier payment term renegotiation (reduce). The board reviews the scenario quarterly.
IT / Cyber incident response: A healthcare organization identifies ransomware as a top-five risk. Controls include endpoint detection, offline backups, and a tested incident response playbook. The KRI is mean time to detect (MTTD), tracked weekly by the CISO. Cyber liability insurance covers breach notification costs (transfer). The risk owner tests the playbook twice a year.
Supply chain disruption: A consumer goods company sources a critical component from a single overseas supplier. The risk team scores this as high likelihood, high impact after a near-miss in the prior year. Treatment: qualify a second supplier (reduce), hold 90 days of safety stock (reduce), and add a force majeure clause to the primary contract (transfer). Construction and manufacturing teams face similar single-source exposure on materials and subcontractors.
Construction project cost overrun: A $120M infrastructure project uses a risk-adjusted budget with a 15% contingency. The project risk register tracks 22 active risks; the top three by score are reviewed weekly by the project director. A risk-tiered approval gate approach controls scope changes: any change above $250K requires a risk impact assessment before approval.
Small companies can run a credible program with a shared spreadsheet register, a monthly 30-minute risk review, and one named risk owner per category. Enterprise programs add GRC tooling, dedicated analysts, and board-level reporting. The process is the same; the infrastructure scales.
How to get started: a 90-day checklist
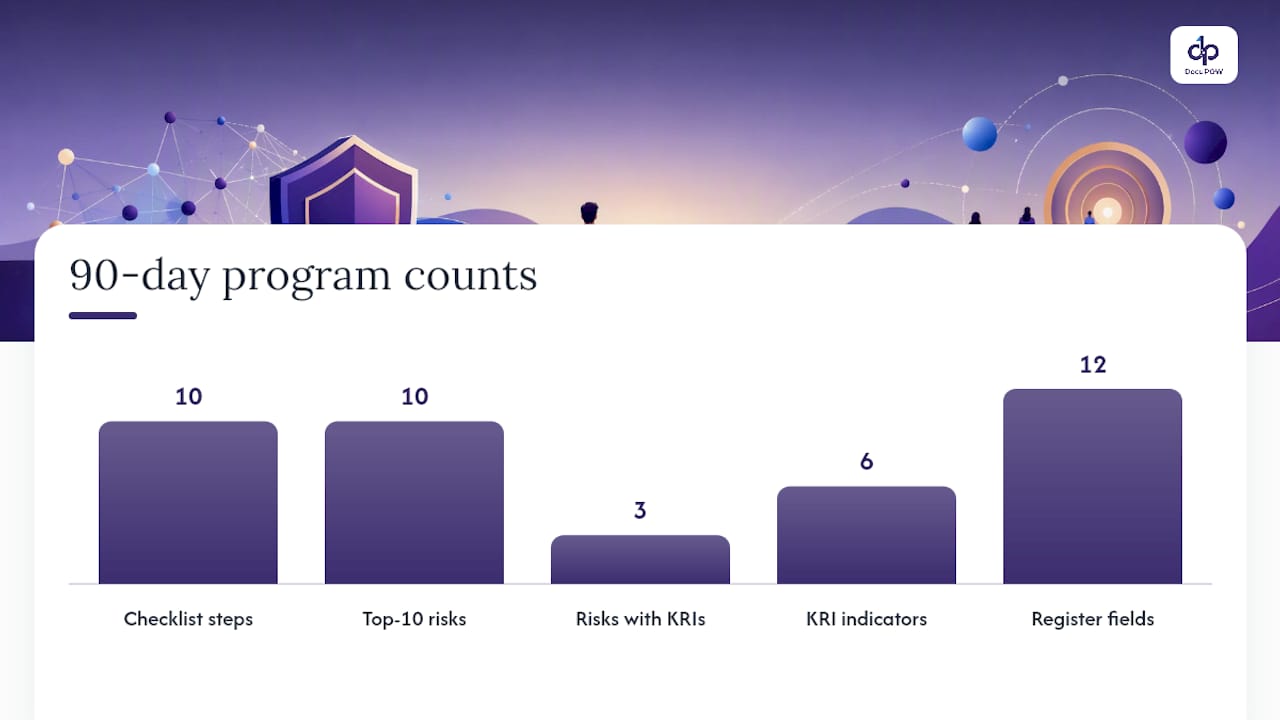
Getting a program off the ground does not require a six-month consulting engagement. Ten steps, executed in 90 days, produce a working foundation.
- Define scope and objectives. Decide which business units and risk categories are in scope for the first cycle. Narrow is better than vague.
- Appoint a risk owner. Name one person accountable for the program. Without a named owner, nothing moves.
- Agree on a risk taxonomy and scoring scale. A 5×5 likelihood-impact matrix with defined descriptors for each level is sufficient to start.
- Run a rapid identification workshop. Two hours with senior leaders produces a working top-10 risk list. Use a structured prompt: “What could prevent us from achieving our top three objectives this year?”
- Build the initial risk register. Use the schema from Section 3. Populate the top 10 risks with owners, scores, and existing controls.
- Assign KRIs to the top three risks. One leading and one lagging indicator per risk, with defined thresholds and a named data owner.
- Identify two quick wins. Automate a high-volume document workflow, fix an overdue control test, or close a known gap. Quick wins build credibility.
- Schedule governance meetings. A monthly risk committee meeting and a quarterly board report. Put them in the calendar now.
- Select a tool. A well-structured spreadsheet works for the first 90 days. Evaluate GRC platforms in months 4–6 once you know your data requirements.
- Plan training. Risk owners need to understand the scoring scale and their reporting obligations before the first cycle closes.
First-90-days roadmap:
| Week | Milestone |
|---|---|
| 1–2 | Scope defined, risk owner appointed, taxonomy agreed |
| 3–4 | Identification workshop complete, top-10 list drafted |
| 5–6 | Risk register populated, owners assigned, KRIs drafted |
| 7–8 | First governance meeting held, quick wins identified |
| 9–10 | KRI data feeds established, reporting template built |
| 11 | First monthly report issued, tool selection shortlist ready |
Mini risk register template (starter fields):
| Field | Purpose |
|---|---|
| Risk ID | Unique reference |
| Risk description | Cause → event → consequence |
| Category | Risk type (operational, cyber, financial, etc.) |
| Owner | Named accountable individual |
| Likelihood (1–5) | Pre-control score |
| Impact (1–5) | Pre-control score |
| Gross score | Likelihood × Impact |
| Controls in place | Current mitigations |
| Residual score | Post-control score |
| Response strategy | Avoid / Reduce / Transfer / Accept |
| KRI | Metric name and threshold |
| Next review date | Scheduled reassessment date |
For due diligence and contract review workflows, AI-driven data extraction can populate risk register fields directly from source documents, cutting the manual entry time that stalls most early-stage programs.
Why risk management must be strategic, not administrative
Most organizations build their risk programs backward. They start with a template, populate a register, and report to the board. Then they wonder why nobody reads the report.
The problem is not the process. It is the framing. Risk management treated as a compliance obligation produces compliance-grade outputs: complete, defensible, and largely ignored by the people making real decisions. Risk management treated as a decision-support function produces something different: a board that asks for the risk analysis before approving a strategy, a CFO who uses scenario outputs to set contingency budgets, and a CRO who sits in the room when the acquisition target is being evaluated.
Three things leaders can do this quarter to close that gap: First, add a standing risk agenda item to every executive team meeting. Not a full report, just a five-minute KRI update and one emerging risk discussion. Second, require a risk impact note on every capital request above a material threshold. One page, three scenarios, a residual score. Third, make the risk register visible to business unit leaders, not just the risk team. Ownership follows visibility.
The NC State data is clear: CEOs and boards increasingly demand robust risk processes, yet many organizations still fail to integrate risk into strategic evaluation. That gap is a competitive advantage for the organizations that close it first.
DocuPOW cuts the manual work that slows risk programs down
Risk programs stall when the data feeding them is slow, incomplete, or locked in documents nobody has time to read. Contracts, vendor agreements, audit reports, and incident logs all carry risk-relevant data. Getting it into a register manually is the bottleneck most programs never solve.
DocuPOW’s AI-powered document automation extracts structured data from any document type without templates, feeding risk registers and KRI dashboards with accurate, timely information. For risk teams, that means three concrete gains: faster data capture (risk register fields populated from source documents in minutes, not days), improved KRI data quality (consistent extraction removes the transcription errors that corrupt trend analysis), and auditable data trails that satisfy internal audit and external assurance requirements. For organizations processing high volumes of risk-related documents, the reduction in manual effort is material. See how DocuPOW’s AI workflow automation fits your risk program at docupow.ai.
Sources
The following primary sources are worth reading directly for governance design, technical controls, and implementation guidance:
- Enterprise Risk Management
- What Is Risk Management & Why Is It Important? | HBS Online
- The State of Risk Oversight: An Overview of ERM Practices (15th Edition)
- Risk Management Process: 5-Step Guide with Examples
- Chapter 5: Risk Management Process | NSW Government
- Risk Management | US EPA
- How To Become A Risk Manager: Career Path, Certifications, Salary, And Skills Guide
FAQ
What is meant by risk management?
Risk management is the systematic process of identifying, assessing, and responding to threats and opportunities that affect an organization’s objectives. When integrated with strategy, it supports better decisions and protects organizational value.
What are the four types of risk management?
Common frameworks describe four response types: avoid (eliminate the risk source), reduce (apply controls to lower likelihood or impact), transfer (shift financial exposure via insurance or contracts), and accept (retain the risk consciously when treatment costs exceed expected loss). A fifth, exploit, applies to upside opportunities.
What are the 5 C’s of risk management?
The “5 C’s” is not a universally standardized framework; definitions vary by source and context. A common version used in practice covers: Context (setting scope and objectives), Criteria (defining risk appetite and scoring scales), Causes (identifying risk sources), Consequences (assessing impact), and Controls (mitigating and monitoring). Always confirm which version your framework or organization uses.
Is risk management a good career?
Risk management is a growing field as boards and regulators demand more formal oversight. The discipline is shifting toward data-driven practice, so professionals who combine quantitative skills with the ability to communicate findings in plain language are in strong demand.
What is enterprise risk management (ERM)?
ERM is an organization-wide approach that integrates risk management across all functions and connects it to strategy and performance. COSO’s ERM Framework organizes it into five components: governance and culture; strategy and objective-setting; performance; review and revision; and information, communication, and reporting.
Recommended
See DocuPOW on your documents.
Stop building templates. Start extracting data.