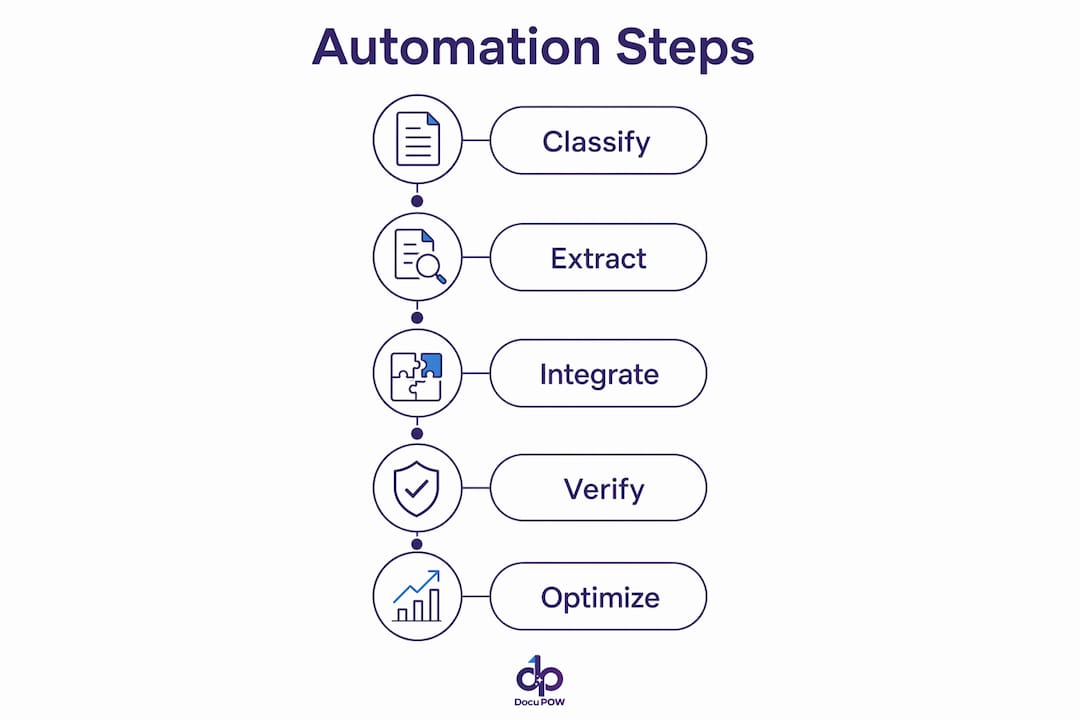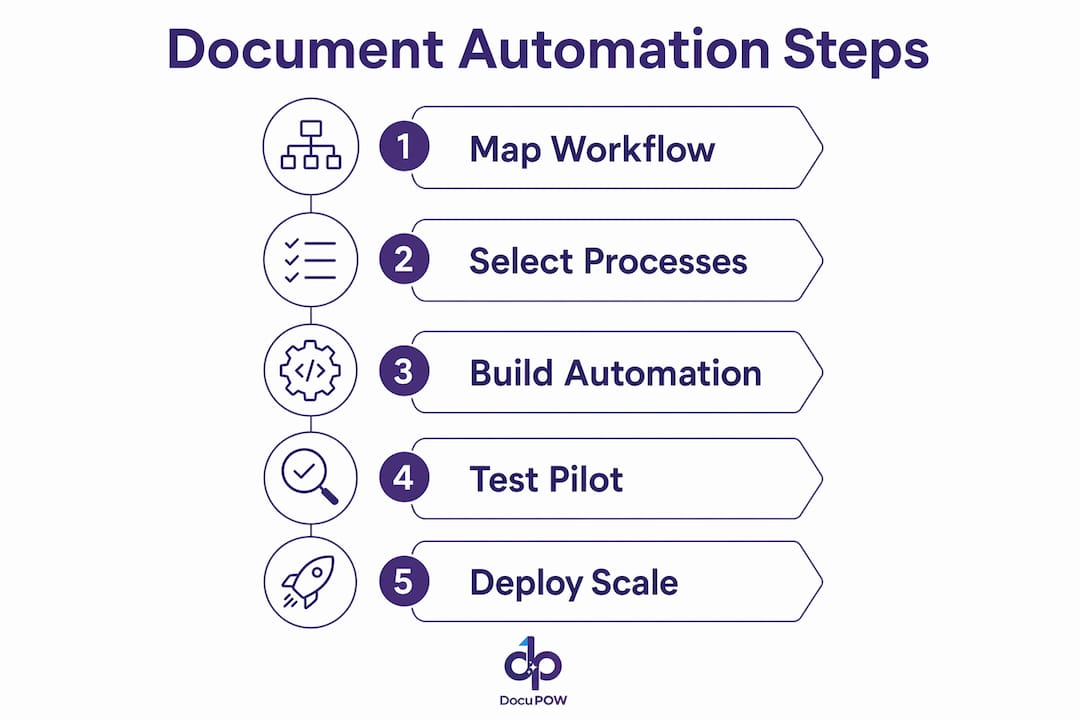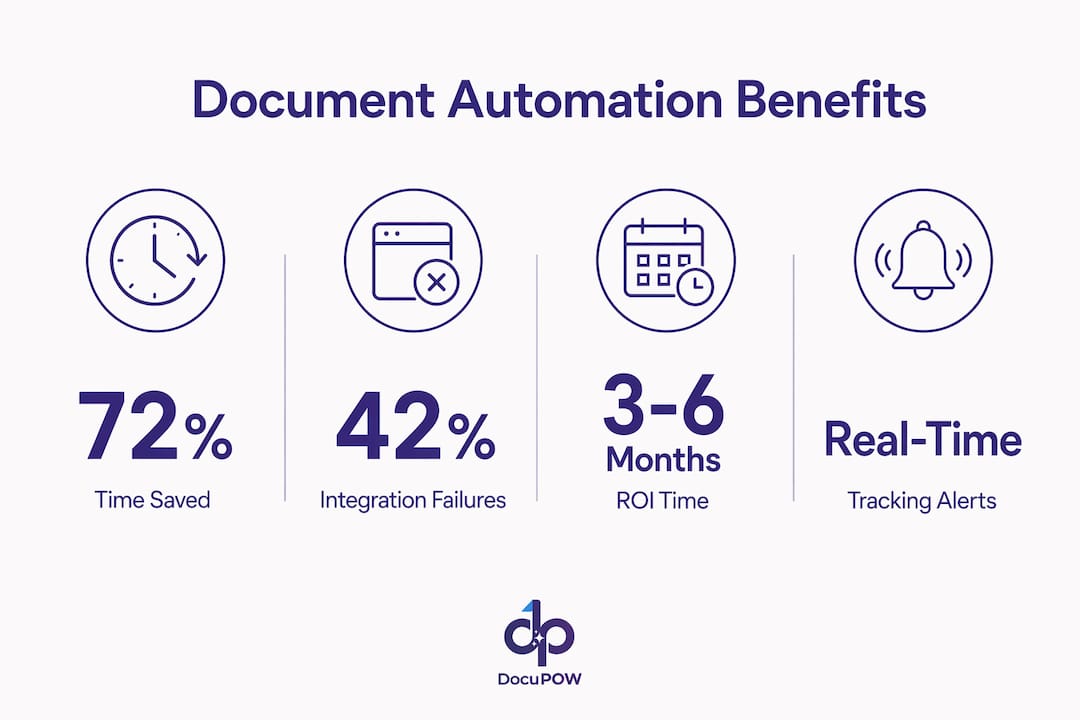
Automating operational reporting workflows is the practice of using software, APIs, and AI to replace manual data gathering, formatting, and report distribution with scheduled, self-running pipelines. Teams that implement this correctly reduce report creation from 15 hours per week to under 5 minutes end-to-end. The tools making this possible include workflow platforms like n8n, AI narrative engines like the Claude API, and distribution integrations with Slack and Gmail. For business analysts and operations managers, the payoff is not just speed. It is consistent, accurate data delivered to the right people without anyone touching a spreadsheet.
What tools and prerequisites do you need to automate operational reporting workflows?
The first requirement is documentation. You cannot automate what you have not mapped. Before touching any tool, write down every step your team takes to produce a report: where the data comes from, who pulls it, how it gets formatted, and where it goes. This step alone exposes redundancies and broken handoffs that would otherwise get baked into your automation.
The second requirement is a stable data layer. Effective reporting automation uses a canonical data warehouse that unifies sources like your CRM, ERP, billing system, and product analytics under a single schema. Without this, your automated reports will surface conflicting numbers. Tools like dbt handle the transformation layer, turning raw database tables into clean, tested metrics your reports can trust.

With those foundations in place, you can select your toolset. The table below maps the core components to their roles:
| Tool category | Example tools | Role in the pipeline |
|---|---|---|
| Workflow automation | n8n, Zapier | Schedules triggers and connects services |
| Data transformation | dbt, Fivetran | Cleans and unifies raw data |
| AI narrative generation | Claude API, OpenAI API | Converts metrics into plain-language summaries |
| Report rendering | Puppeteer, Pandoc | Generates PDF or HTML output |
| Distribution | Slack API, Gmail API | Delivers reports to recipients automatically |
Key prerequisites before you build:
- Define your metrics clearly. Agree on how revenue, churn, or utilization are calculated before automating.
- Establish data cutoff policies. Decide when data is “final” for each reporting period.
- Assign ownership. Each data source needs a named owner who handles quality issues.
- Test your data pipeline independently. Automation should not be the first place you discover data errors.
Pro Tip: Start with one report that already works well manually. Automate it first, validate the output against your manual version for two weeks, then expand. This builds confidence and catches edge cases early.
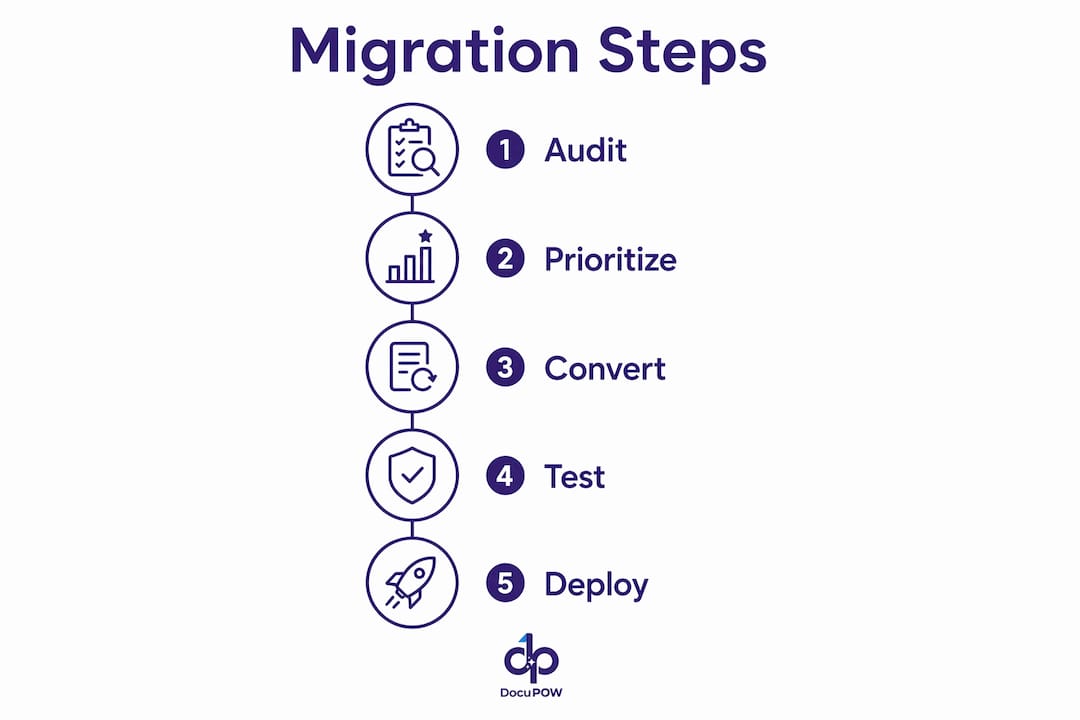
Step-by-step process to automate your reporting workflow
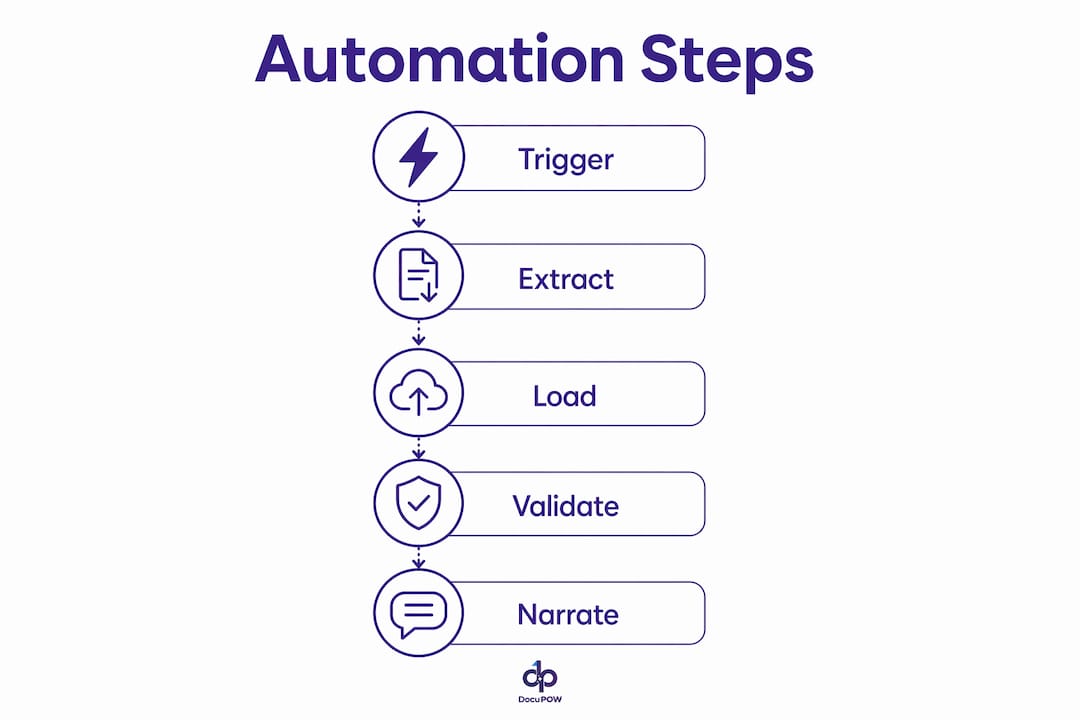
A working automation pipeline follows a clear sequence. Each step hands off to the next, and each one has a specific tool doing a specific job.
-
Schedule the trigger. Use a cron job inside n8n or a similar platform to fire the pipeline at a set time, such as every Monday at 6 a.m. This replaces the analyst who previously remembered to run the report.
-
Extract the data. The workflow calls your data warehouse via API or SQL query. If you use dbt, your models are already tested and ready. The pipeline pulls only the metrics defined in your canonical layer.
-
Transform and validate. Run lightweight checks inside the workflow: are row counts within expected ranges? Are any key metrics null? If a check fails, the pipeline sends an alert to Slack instead of distributing a broken report.
-
Generate the narrative. Pass the validated metrics to the Claude API or a comparable AI model. Provide a structured prompt that specifies the report format, the audience, and the tone. The model returns a plain-language summary that explains what the numbers mean.
-
Render the report. Use Puppeteer or Pandoc to convert the AI output and raw data into a formatted PDF or HTML document. This step handles branding, tables, and charts.
-
Distribute automatically. The final step sends the rendered report to a Slack channel, an email list via Gmail API, or a shared dashboard. No human intervention is needed.
| Step | Action | Tool |
|---|---|---|
| 1. Trigger | Schedule pipeline run | n8n cron job |
| 2. Extract | Pull metrics from warehouse | SQL query or API |
| 3. Validate | Check data quality | n8n conditional logic |
| 4. Narrate | Generate plain-language summary | Claude API |
| 5. Render | Format into PDF or HTML | Puppeteer, Pandoc |
| 6. Distribute | Send to Slack, email, dashboard | Slack API, Gmail API |
Pro Tip: Build your validation step before your narrative step. An AI model given bad data will produce a confident, well-written summary of incorrect numbers. Catching errors before the narrative stage saves you from distributing misinformation.
How do you troubleshoot common obstacles in reporting automation?
The most common cause of automation failure is automating a broken process. Most automation failures occur when teams skip documentation and stabilization, then wonder why their pipeline accelerates errors instead of eliminating them. If your manual report regularly contains data disputes, your automated version will produce those disputes faster and at scale.
The second major obstacle is metric inconsistency. When different systems define “active users” or “monthly revenue” differently, automated reports surface contradictions that erode trust. A canonical data layer solves this, but only if it is governed. Governed feedback loops that centralize business rule definitions let you propagate changes across all reports instantly, replacing the chaos of disconnected spreadsheet updates.
Common pitfalls and how to address them:
- Undocumented edge cases. Month-end adjustments, refunds, and manual corrections often live only in someone’s memory. Document them before automating.
- Fragile API connections. External data sources change their schemas. Build error handling that alerts your team when a source feed breaks.
- No feedback mechanism. Report recipients notice errors that builders miss. Create a simple channel, such as a Slack thread or a form, where readers can flag issues.
- Big-bang rollouts. Phased improvements prioritized by stabilizing inputs first, then automating reconciliations, then adding compliance controls, consistently outperform total overhauls.
“Treating reporting automation purely as a technology project causes failures. Deep understanding of workflows and phased deployment is the difference between a pipeline that runs and one that gets trusted.”
The teams that succeed treat automation as a process redesign project that happens to use software. The technology is the easy part.
How does AI enhance operational report automation beyond dashboards?
Traditional dashboards are reactive. They show you what happened after you log in and look. AI-driven insights agents proactively detect outliers, perform root-cause analysis, and generate plain-language incident summaries, cutting problem investigation time from days to minutes. That shift from reactive to proactive is the real efficiency gain in modern reporting workflow optimization.
The specific capabilities AI adds to a reporting pipeline include:
- Anomaly detection. The system flags when a metric deviates from its expected range, without waiting for an analyst to notice.
- Root-cause analysis. When revenue drops, the AI cross-references related metrics, such as traffic, conversion rate, and refunds, to identify the likely cause.
- Plain-language summaries. Operators read narrative summaries more than charts. Automated narrative generation converts data tables into sentences that non-technical stakeholders can act on immediately.
- Proactive alerts. Instead of a weekly report, the system sends a message when something requires attention, regardless of the schedule.
AI-driven reporting workflows save organizations 2 to 6 hours per week per employee by replacing manual data gathering and formatting. Across a team of ten analysts, that is up to 60 hours recovered every week. The role of AI agents in operational decisions is expanding precisely because the time savings compound at the team level, not just the individual level.
The integration path is straightforward. Your n8n workflow calls the AI model after the data validation step. The model receives structured JSON with your metrics and returns a narrative block. That block gets inserted into your report template before rendering. No separate AI platform is required.
Key takeaways
Automating operational reporting workflows requires stable data, documented processes, and a phased rollout before any pipeline goes live.
| Point | Details |
|---|---|
| Document before automating | Map every manual step and data source before writing a single line of automation logic. |
| Build a canonical data layer | Unify CRM, ERP, and billing data under one schema to prevent metric conflicts across reports. |
| Validate data before narrating | Run quality checks before passing metrics to an AI model to avoid distributing confident errors. |
| Use phased rollouts | Automate one working report first, validate it, then expand to avoid compounding broken processes. |
| Add AI narrative generation | Plain-language summaries drive faster decisions than charts alone, especially for non-technical stakeholders. |
Why I think most teams automate in the wrong order
The standard advice is to pick a tool and start building. I have watched that approach fail repeatedly. Teams spend weeks configuring n8n workflows before they have agreed on what “monthly recurring revenue” means across their CRM and billing system. The pipeline runs perfectly and delivers wrong numbers on schedule.
The teams that get this right spend the first two weeks doing nothing but mapping. They draw the actual workflow, not the calendar. They find the analyst who manually adjusts the export every quarter-end and document exactly what she changes and why. That knowledge becomes the business rule that goes into the governance layer.
The second thing I would push back on is the instinct to automate everything at once. Phased deployment is not a compromise. It is the correct engineering approach. You stabilize inputs, automate one reconciliation, validate it for a month, then move to the next. Each phase builds trust with the stakeholders who receive the reports.
The future of this work is not better dashboards. It is AI agents that monitor your operations continuously and surface the one thing that needs your attention today. That shift requires the same foundation: clean data, documented rules, and a pipeline you trust. Build the foundation first. The AI layer is straightforward once the data is reliable.
— Sameer
How DocuPOW fits into your automation pipeline
Operational report automation depends on clean data extraction from the documents feeding your systems. Purchase orders, invoices, and operational records locked in PDFs or scanned files create gaps in your data layer before automation even begins.
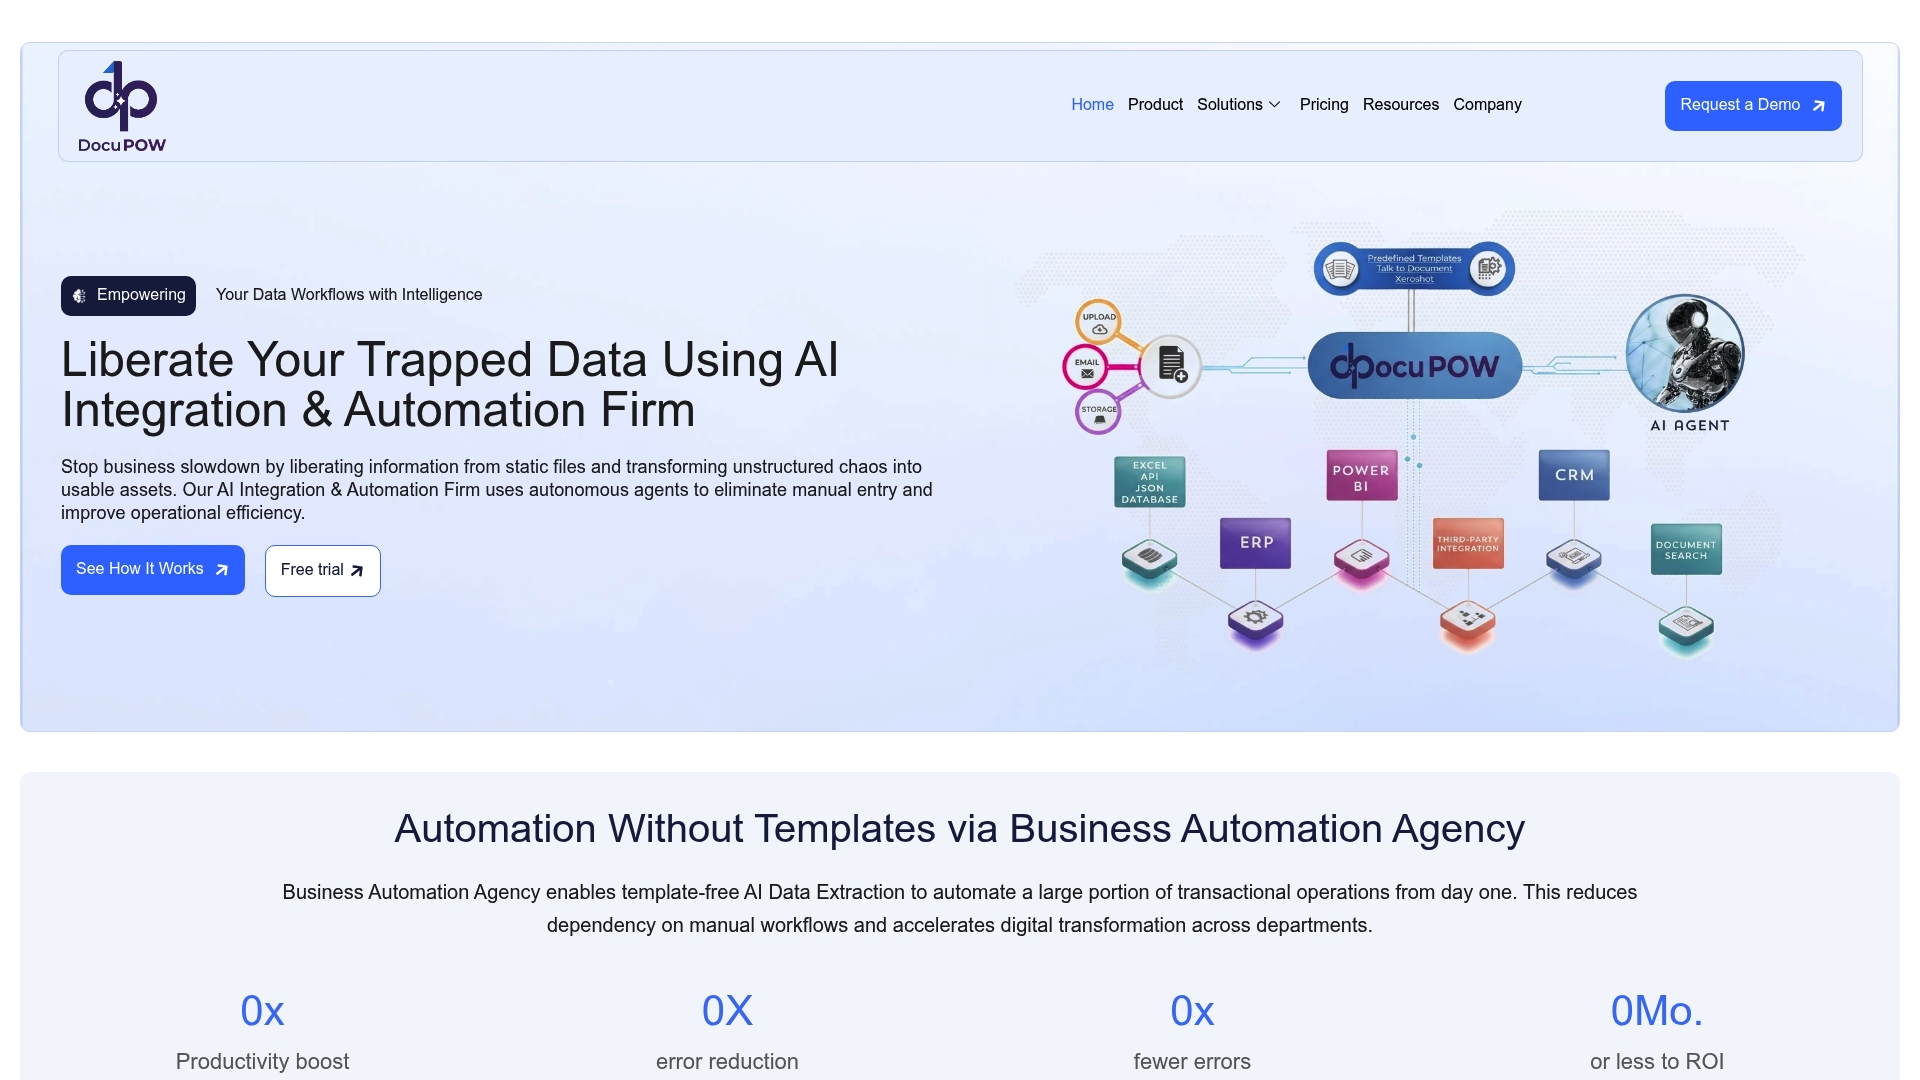
DocuPOW uses autonomous AI agents to extract data from documents without rigid templates, feeding your canonical data warehouse with accurate, structured records. For business analysts and operations managers, that means the data entering your reporting pipeline is clean from the source. Explore the document process automation benefits DocuPOW delivers for operations teams, or see how agentic AI back-office automation closes the gap between document intake and automated reporting.
FAQ
What is operational reporting workflow automation?
Operational reporting workflow automation is the use of software, APIs, and AI to replace manual data collection, formatting, and report distribution with scheduled pipelines. Tools like n8n, dbt, and the Claude API handle each stage without human intervention.
How much time can automation save on reporting?
Automation can reduce report creation from 15 hours per week to under 5 minutes per pipeline run. At the team level, AI-driven workflows save 2 to 6 hours per employee per week.
What should I do before automating my reports?
Document every manual step, stabilize your data inputs, and define your metrics clearly before building any automation. Automating an undocumented or broken process accelerates errors rather than eliminating them.
Do I need a data warehouse to automate reporting?
A canonical data warehouse is the most reliable foundation for automated reporting. It unifies data from your CRM, ERP, and billing systems under a single schema, preventing metric conflicts that undermine report accuracy.
What role does AI play in automated reporting?
AI generates plain-language narrative summaries, detects anomalies, and performs root-cause analysis automatically. These capabilities shift reporting from reactive dashboards to proactive alerts that reach the right people before problems escalate.